Updated Daily
Moving Averages:
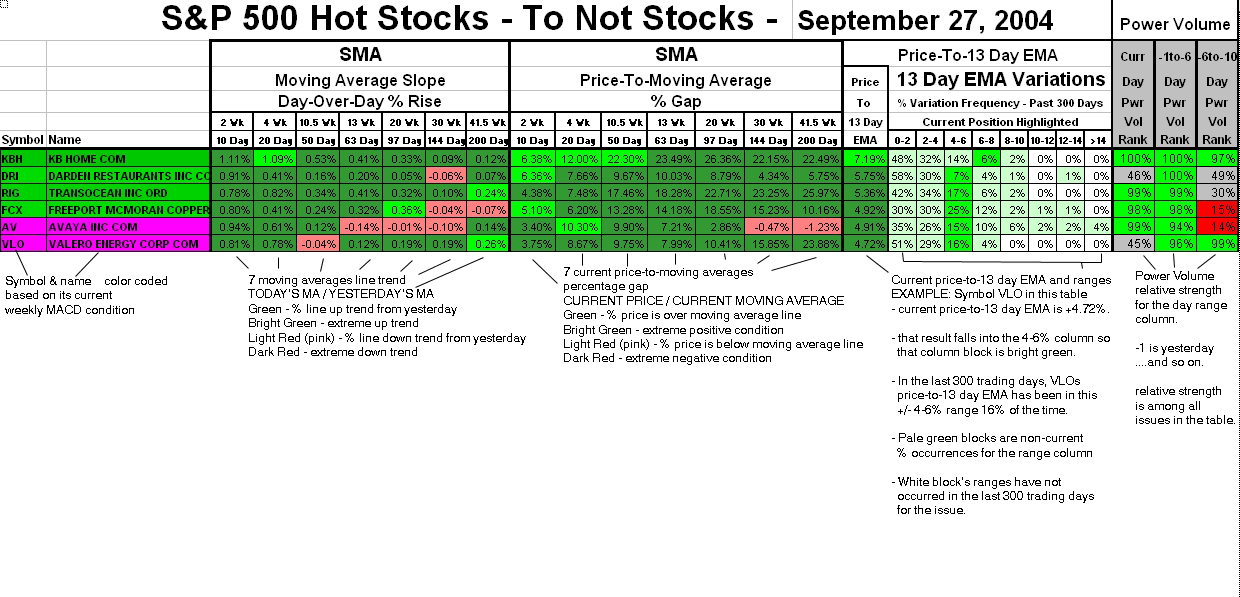
The above tables list current stats on 7 moving averages for each component. It is sorted by the current price-to-13 day EMA of each component, highest to lowest. It also shows a percentage frequency that the indicated issue has been within a specified price-to-13 day EMA range over the past 300 trading days, and plots the issue's current position. It lists them from the hottest to the nottest.
SAMPLE EXAMPLE:
 MORE TO COME!!
The charts and tables here do not represent any recommendation from myself to buy or sell any security. I also do not guarantee the accuracy of these charts and graphs as the data is provided to me without guarantee.
I welcome and encourage feedback.